New AgMIP paper shows how farmers may be misled by their early climate change experience
Analysis of crop yields by global warming level highlights nonlinear responses and climate-crop model uncertainties
By Natalie Kozlowski
15 April, 2024
GWL response patterns identify misleading initial crop yield impacts
A new paper looks at the experience of farmers as their yields change in a warming world, finding distinctive patterns of change for each regional system. Published by Agricultural Model Intercomparison and Improvement Project (AgMIP) Climate Team leader Alex Ruane and colleagues from the AgMIP Global Gridded Model Intercomparison Research Team, this study utilizes the projections of climate change impacts under various climate scenarios from Jägermeyr et al. (2021) and examines yield impacts from the perspective of global warming levels (GWLs; defined as global surface air temperature compared to the 1850-1900 pre-industrial period). GWLs are the centerpiece of the 2015 Paris Agreement and many negotiations at the United Nations Framework Convention on Climate Change (UNFCCC), which have committed countries to reducing their greenhouse gas (GHG) emissions to keep the world well below the 1.5℃ and 2.0℃ targets, which are designated as upper limits.
Climate scientists have shown that many regional climate conditions are consistent at a given GWL regardless of the pathway by which the world arrives at that GWL. In other words, a 2℃ world at the end of the century will have a similar climate structure as a 2℃ world in the middle of the century, despite potentially having taken different paths to reach that degree of warming. Exceptions include slow-responding parts of the climate system like ice sheets and sea levels. Few studies have extended the GWL framework into climate impacts. This study shows that there are useful lessons and also methodological challenges in understanding impacts from a GWL perspective.
Climate change response patterns
Researchers analyzed an ensemble of crop models and climate model projections as the world warms, identifying common patterns of climate change response on each grid cell and crop system (maize, wheat, rice, and soybean). They classified each location first by the long-term direction of change: increase (blue shades), neutral (purple shades), or decrease (red shades); and then by the linearity or non-linearity of its GWL response. In many cases, yields showed a consistent direction of change across all GWLs (i.e. areas that see initial yield decreases continue to see a decrease as warming continues). In other cases, yields decline, or dip, at first but level off or even begin to increase as the world gets warmer. The final case is when we see an initial yield increase or peak, but then see a leveling off or decline with further warming. The three directions of change (increase, decrease, neutral) and the three types of yield non-linearities (consistent, dip, and peak) create nine possible yield response patterns, represented by the illustrative response patterns and color coding in Figure 6.
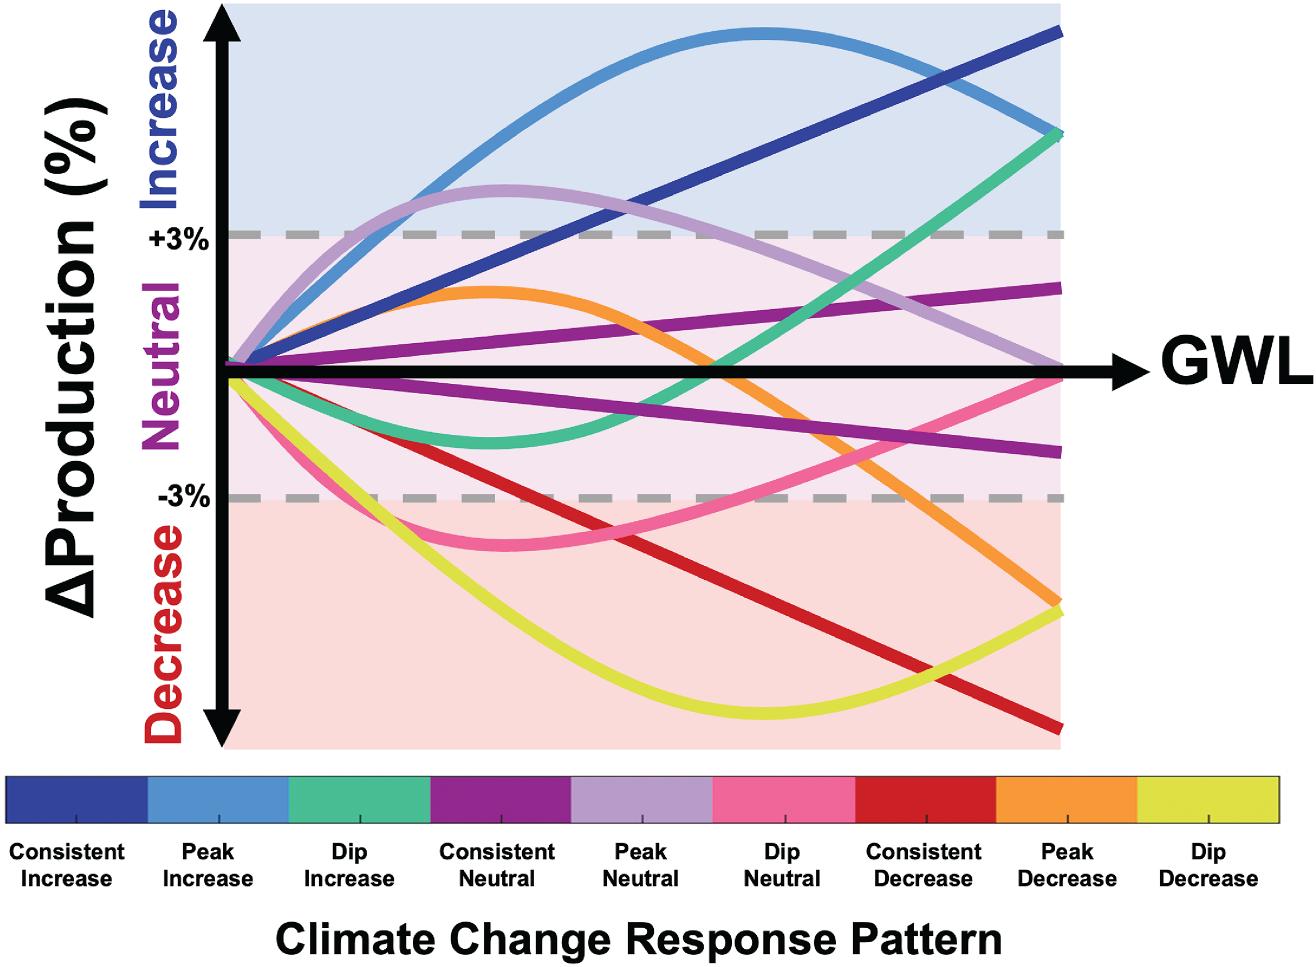
Figure 6. Schematic illustrating representative climate change response pattern, categorized by their shape as global warming levels increase and their direction of change at the highest GWL evaluated.
GWL response patterns for each region and crop species allowed researchers to characterize farmers’ projected experience as the world warms. These results are without adaptation, but simulation results indicate that farmers will be motivated to adapt by the changes they observe and anticipate. Contradictions between observed trends and long-term trajectories are particularly problematic given that adaptation strategies often require anticipatory investments and capacity-building that may be withheld if farmers are complacent due to early climate change benefits (most notably in the orange peak decrease regions).
Maize was identified by Jaegermeyr et al. as the major cereal crop with the largest and most widespread yield decreases under climate change. Many maize regions show consistent decreases (red). However, several regions are characterized by a peak decrease patterns (orange), whereby farmers will see initial yield increases (driven by slightly warmer temperatures and elevated CO2 concentrations) followed by larger decreases (as temperature and potential drought effects overwhelm any benefits seen from increased CO2 concentrations). This includes portions of major food baskets including portions of the upper US Midwest and Central Europe. For wheat yields, many areas are characterized by a consistent increase (dark blue) pattern, given that wheat tends to be grown in cool seasons and climates and sees substantial benefits from CO2 concentration increases. A large proportion of wheat regions show peak increase patterns where yield levels off or is reduced at higher GWLs (light blue), indicating that farmers might benefit from recognizing a diminishing benefit from climate change. Other wheat regions show the peak decrease pattern (orange), indicating misleading initial increases that will give way to long-term declines. These regions include portions of southern Canada, Northwest India, and Pakistan. Rice and soybean also show regions with consistent increases or characterized by the diminishing benefit peak increases pattern. Areas with the peak decrease pattern (orange) include rice in Northwest India and soybean in the western U.S. Midwest, portions of central Brazil, and southeastern Europe.
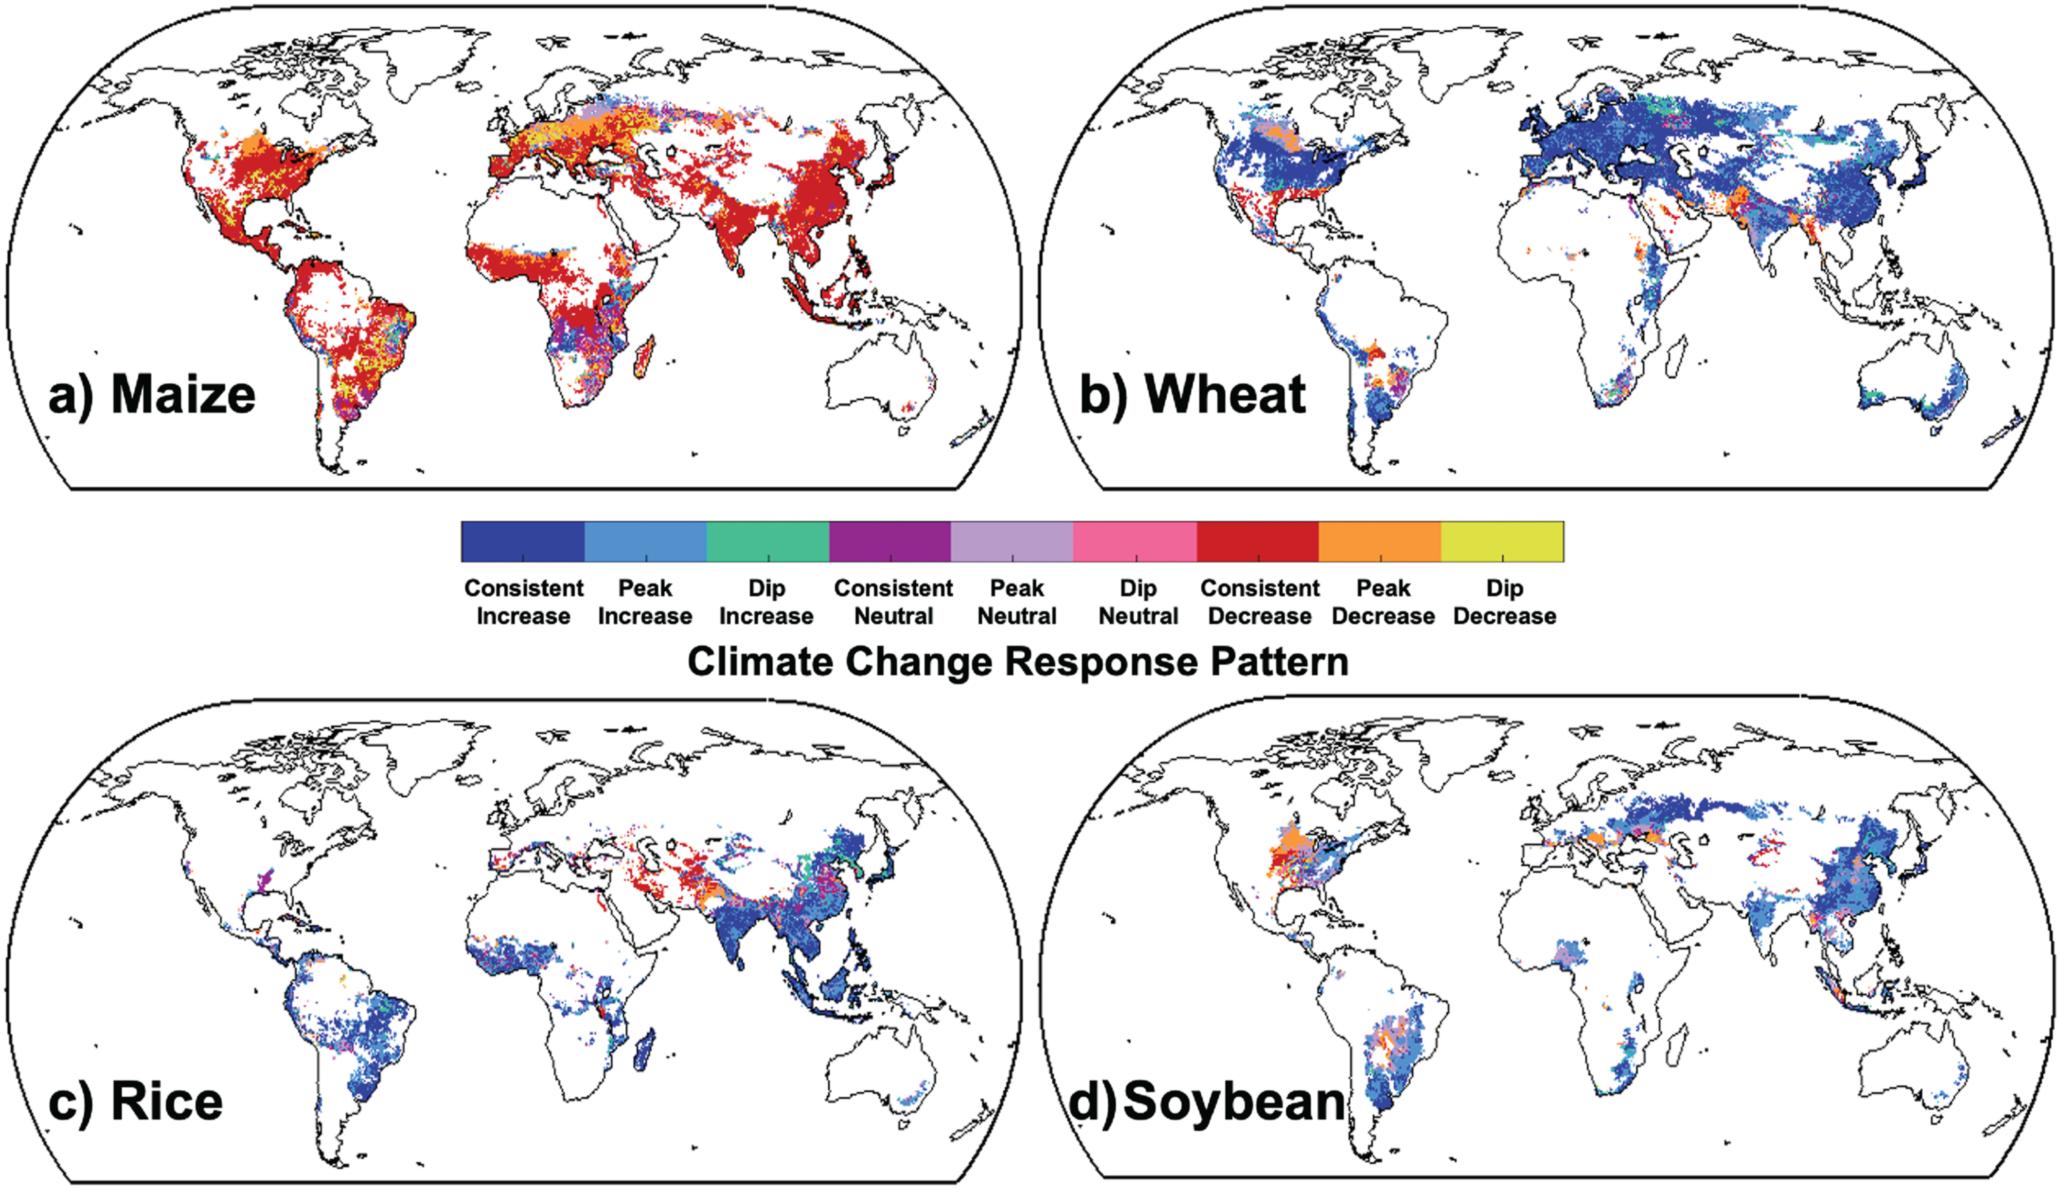
Figure 7. Regional climate change response patterns for maize, wheat, rice, and soybean from the ensemble of all very high emission scenario climate and crop models. Patterns at each grid cell were derived from mean production changes over 0.69-3.5ºC GWLs. Only grid cells with >10 ha cultivated areas are shown.
How climate model uncertainty can lead to crop yield projection bias
The new paper also shows how ensembles of crop and climate model projections can be useful in assessing future impacts from a GWL perspective. The availability of a crop yield ensemble was made possible by AgMIP’s coordinated efforts – an ensemble of models allows for more consistent assessments of future impacts. The crop yield simulations were run using outputs from five global climate models (GCMs), each of which can be characterized by its equilibrium climate sensitivity (ECS). ECS is a measure of how much global warming will occur if GHG concentrations are doubled from the pre-industrial value. Models with a high ECS warm faster as society emits more GHGs, but this means that they reach any given GWL faster than models with a lower ECS, and thus have a lower CO2 concentration at each GWL. For example, at a GWL of 3℃, the models used in this paper reach CO2 concentrations that range from 525-745 ppm.
Because surface-level CO2 benefits crop photosynthesis and water retention, climate models with high climate sensitivity have the weakest CO2 benefits, and therefore the most pessimistic projections at each GWL. This crop yield bias reflects uncertainty in the climate models and the climate impact projection pipeline, indicating that caution should be taken in applying a GWL lens to climate impact analysis. Similar correlated effects would also be likely for other ecological impacts where CO2 is a substantial benefit (e.g., forests, grasslands, biodiversity), and for the same reason lower ECS models would be connected with reduced ocean acidification impacts on marine ecosystems. The paper also identifies potential pitfalls related to the selection bias of climate models representing the highest GWLs, since they may only be reached by models with the highest ECS. For example, modelers looking for impacts at a GWL of 4℃ will find that this level is only reached by the hottest (high ECS) models before 2100, which will in turn have the most pessimistic outlooks regarding yield impacts.
Important insight into impacts and adaptation strategies
The new Earth’s Future study demonstrates how crop models and the AgMIP community are providing important insight into the future of food systems and agricultural stakeholders around the world. Food production changes will also affect food insecurity and the potential for socio-economic disruption and migration pressure. GWL response pattern methods presented here for the agricultural system could also provide key insights into impacts for other sectors and systems (i.e. livestock, fisheries, ecosystems, human health, infrastructure) and can help prioritize adaptation strategies and their timely implementation.
Additional Resources:
Ruane et al. 2024 in Earth’s Future: https://agupubs.onlinelibrary.wiley.com/doi/10.1029/2023EF003842
Jägermeyr et al. 2021: https://www.nature.com/articles/s43016-021-00400-y
Contact info:
Dr. Alex Ruane – alexander.c.ruane@nasa.gov
Dr. Jonas Jägermeyr – jonas.jaegermeyr@columbia.edu
Natalie Kozlowski – n.kozlowski@columbia.edu